


CHARTING
THE TIDES
2025 Trends: Data-Driven Insights Into the Crypto Market


Bull markets are characterized by a gradual transfer of wealth from long-term investors to newer and often more speculative investors. A significant portion of the speculative investors can be considered retail investors, attracted by the surging price appreciation and the allure of quick returns.
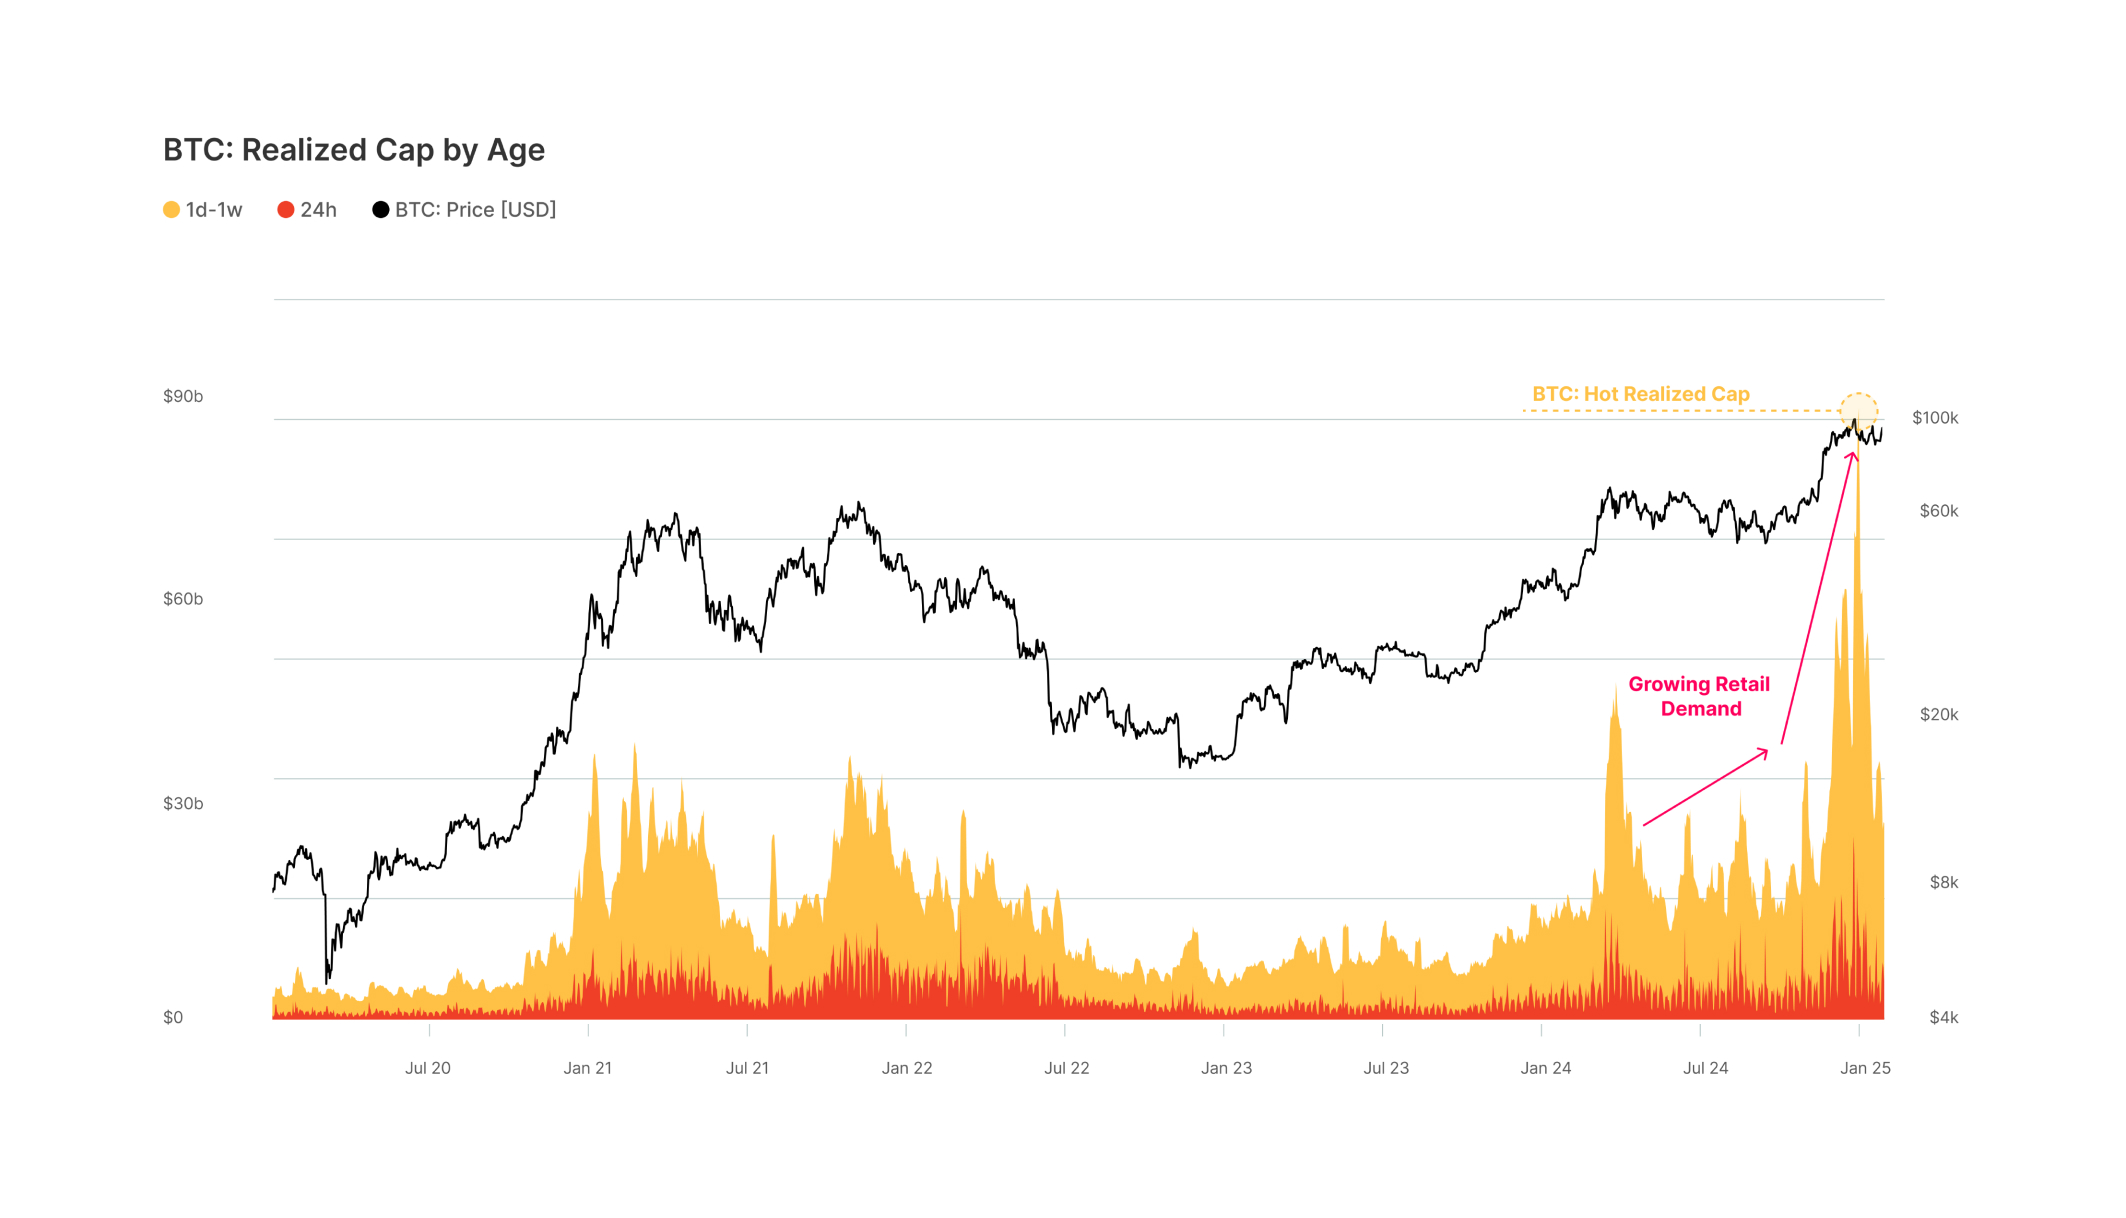
- To assess the influx of new demand, we can isolate the realized cap for coins that have recently changed hands ('hot realized cap'). This metric assesses the capital held by accounts that have been active in the last seven days.
- We can utilize this metric as a proxy to evaluate the current magnitude of new market demand. By this measure, the major digital assets have experienced an uptick in new demand.
- Across the $100k ATH, new bitcoin investors held $99.6B of the network’s capital, equivalent to 13.7% of the total network wealth. The last cycle peaked at a value of $45.3B, with a network share of 22.5%. The increase in the hot realized cap suggests both strong market demand and the return of retail investors, while also inferring room for further growth.
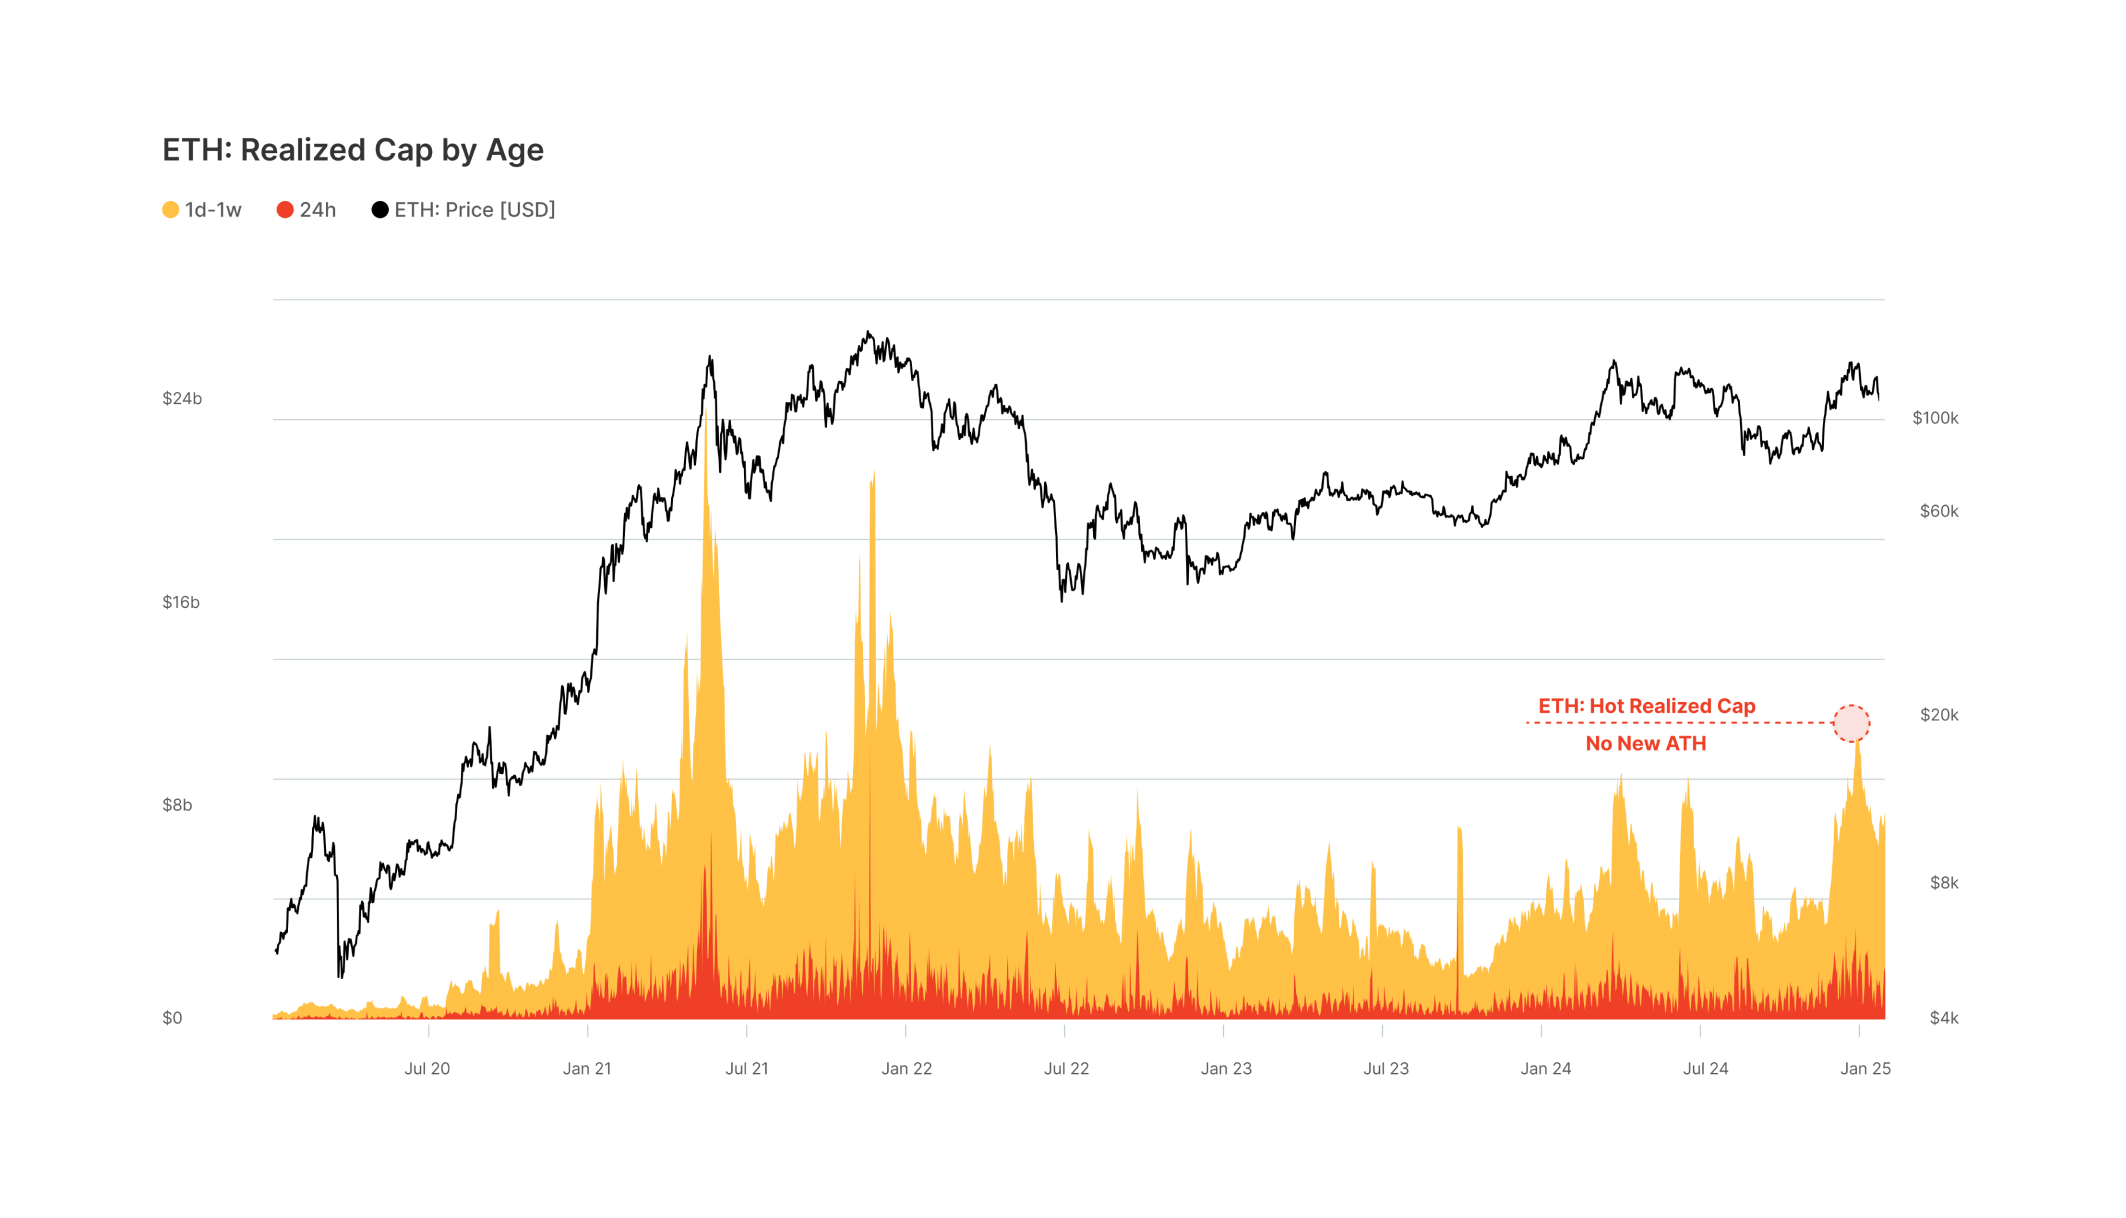
- The ethereum hot realized cap current cycle peak is $11.6B, equivalent to 4.7% of total network wealth. However, the asset remains well below the all-time high set in May 2021.
- This suggests that Ethereum has lagged both Bitcoin and Solana in attracting attention this cycle, especially amongst speculators and retail investors.
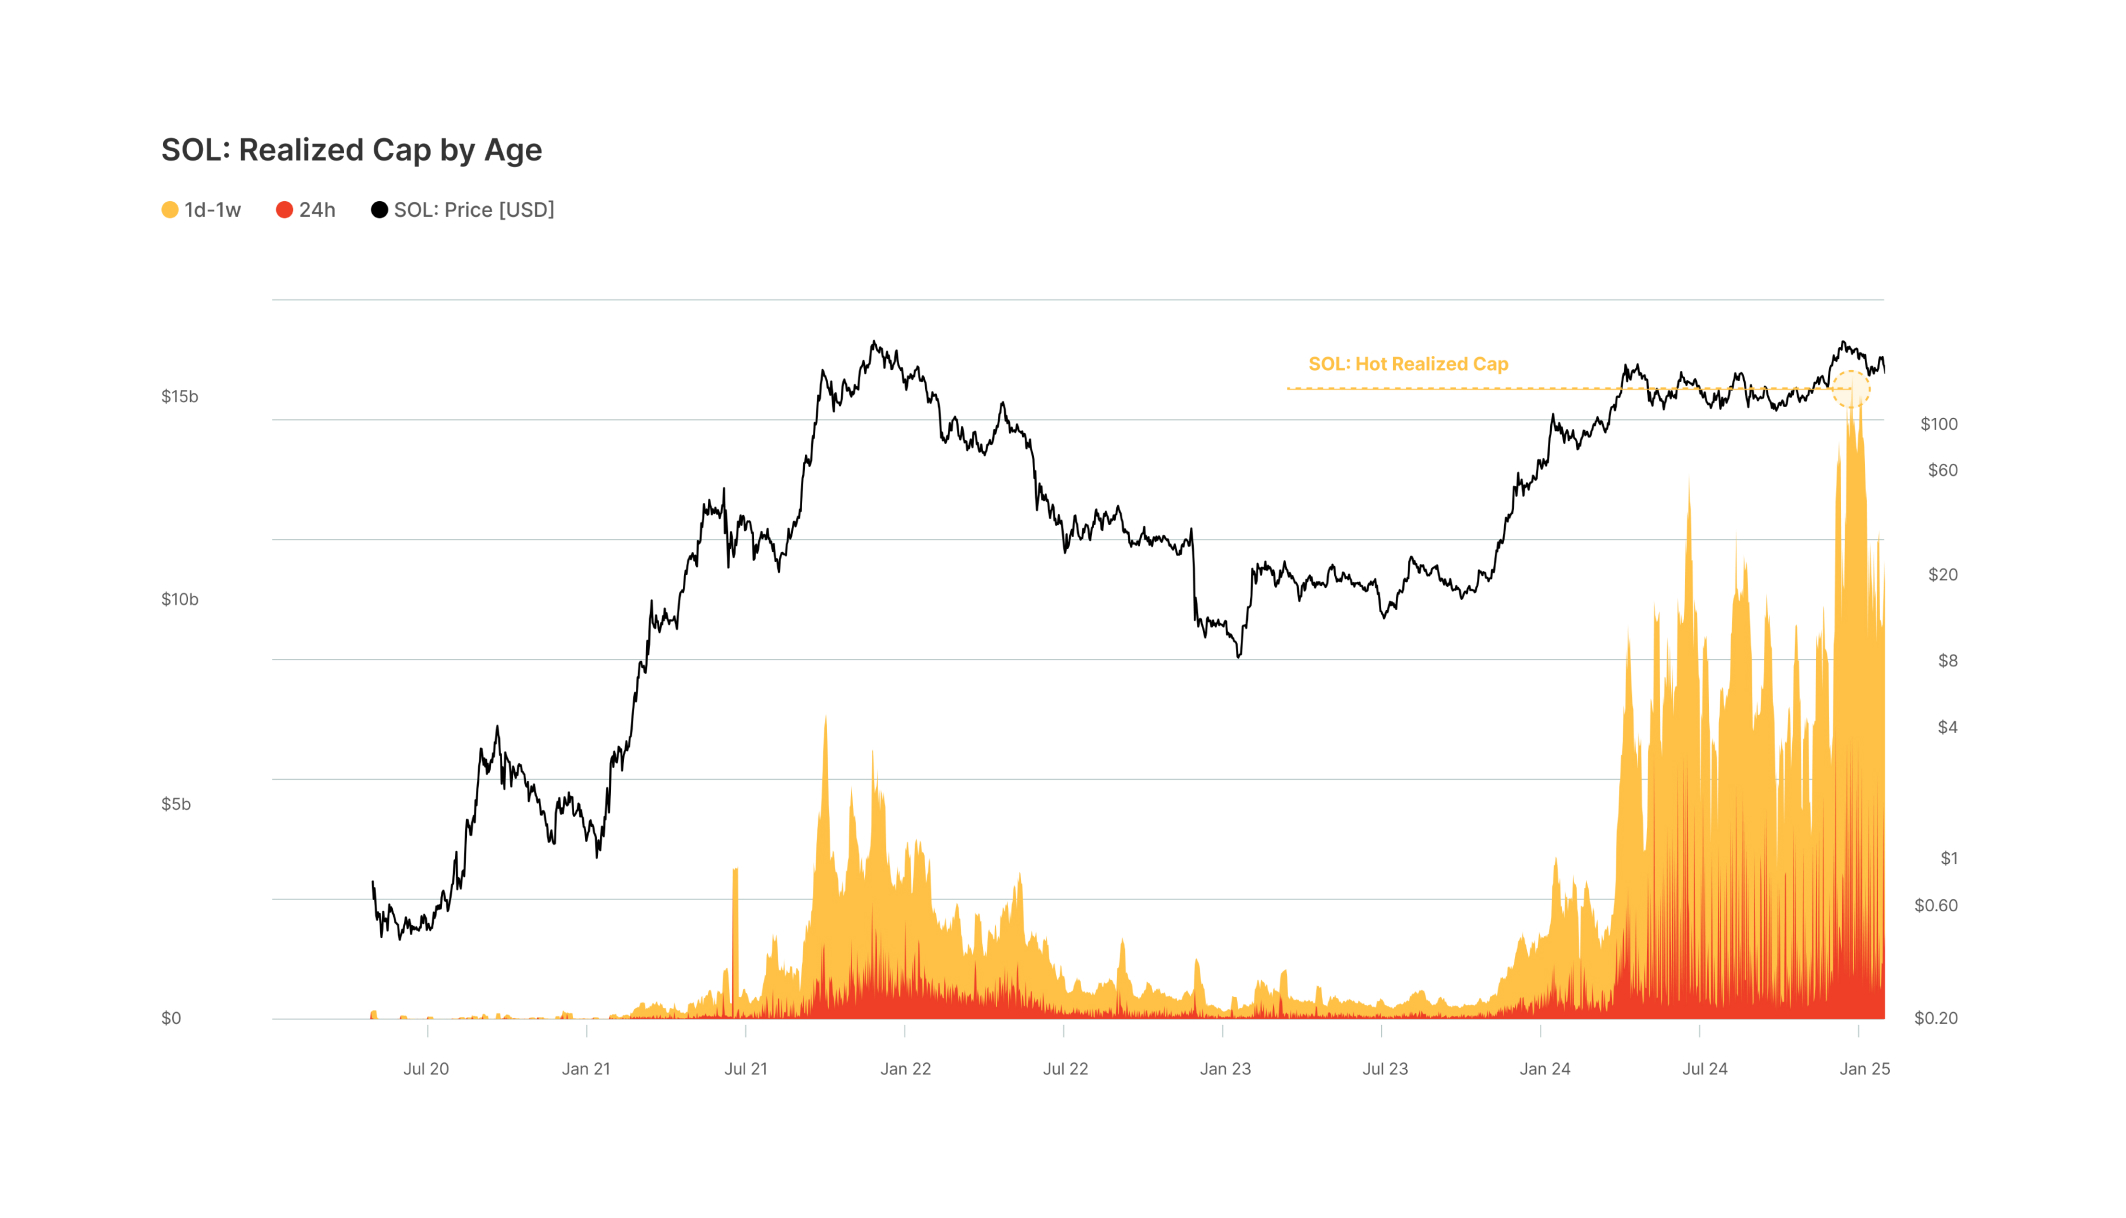
- Moving to Solana, new investor wealth held has currently peaked at a value of $15.8B, equivalent to 21% of the total capital.
- The large proportion of realized cap held by new demand investors suggests that SOL has been the choice asset amongst market speculators this cycle, acquiring significant capital from retail participants.


Solana Surge
Active Solana Addresses Exceed Bitcoin
Another method for evaluating network activity is to measure the active addresses, transfer volume and fees across the major blockchains. Periodic elevations in these metrics can be used as a proxy for retail activity in the market. Notably, the Solana network is dominant across all three measures.

- Active addresses (the number of unique addresses that were active in the network either as a sender or receiver) on Solana have surpassed those on Bitcoin (~760K addresses/day) and Ethereum (~501k addresses/day) by a significant margin since December 2023.
- With 12.3M daily active addresses, Solana currently has 16.2x more active addresses than Bitcoin and 24.6x more than Ethereum.


Solana Surge
Retail Investors
Bet Big On Solana
For the first time in history, Solana has overtaken Ethereum in terms of the capital held by retail investors, providing another metric to showcase its dominance as the choice asset for new investors.
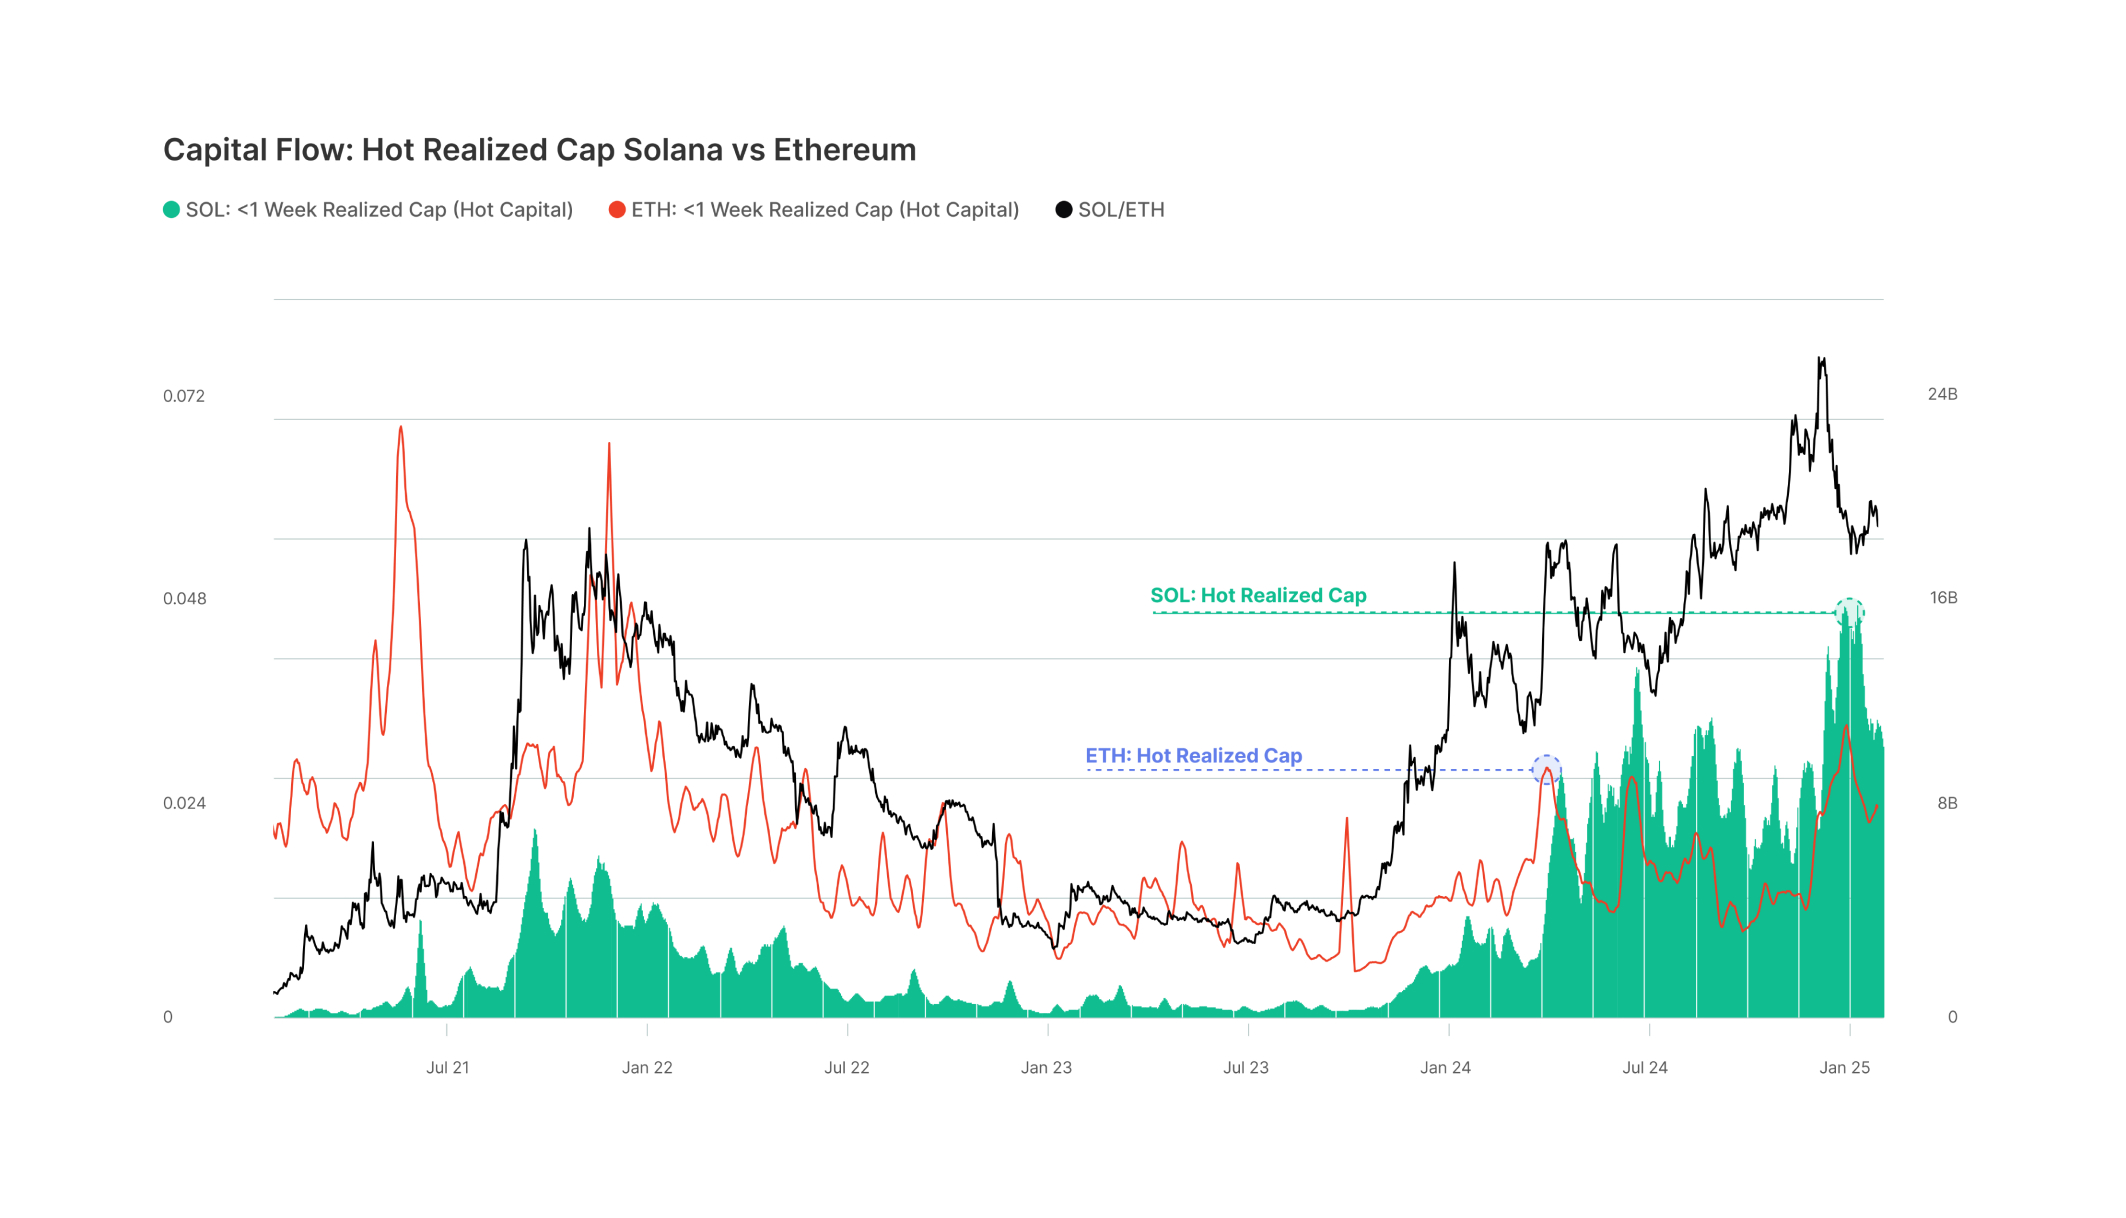
- When comparing the magnitude of new capital acquisition between Solana and Ethereum, we can observe that Solana has overtaken Ethereum for the first time in history, highlighting its robust demand profile and growing market relevance.
- Notably, there has been more active capital entering Solana compared to Ethereum, which has been a driving factor for growth and outperformance.
- The influx of capital began in Oct 2023, marking the upward inflection point in the SOL / ETH ratio.


Memecoin Mania
Memecoins Attracted the Largest Share of Capital Across Altcoins in 2024
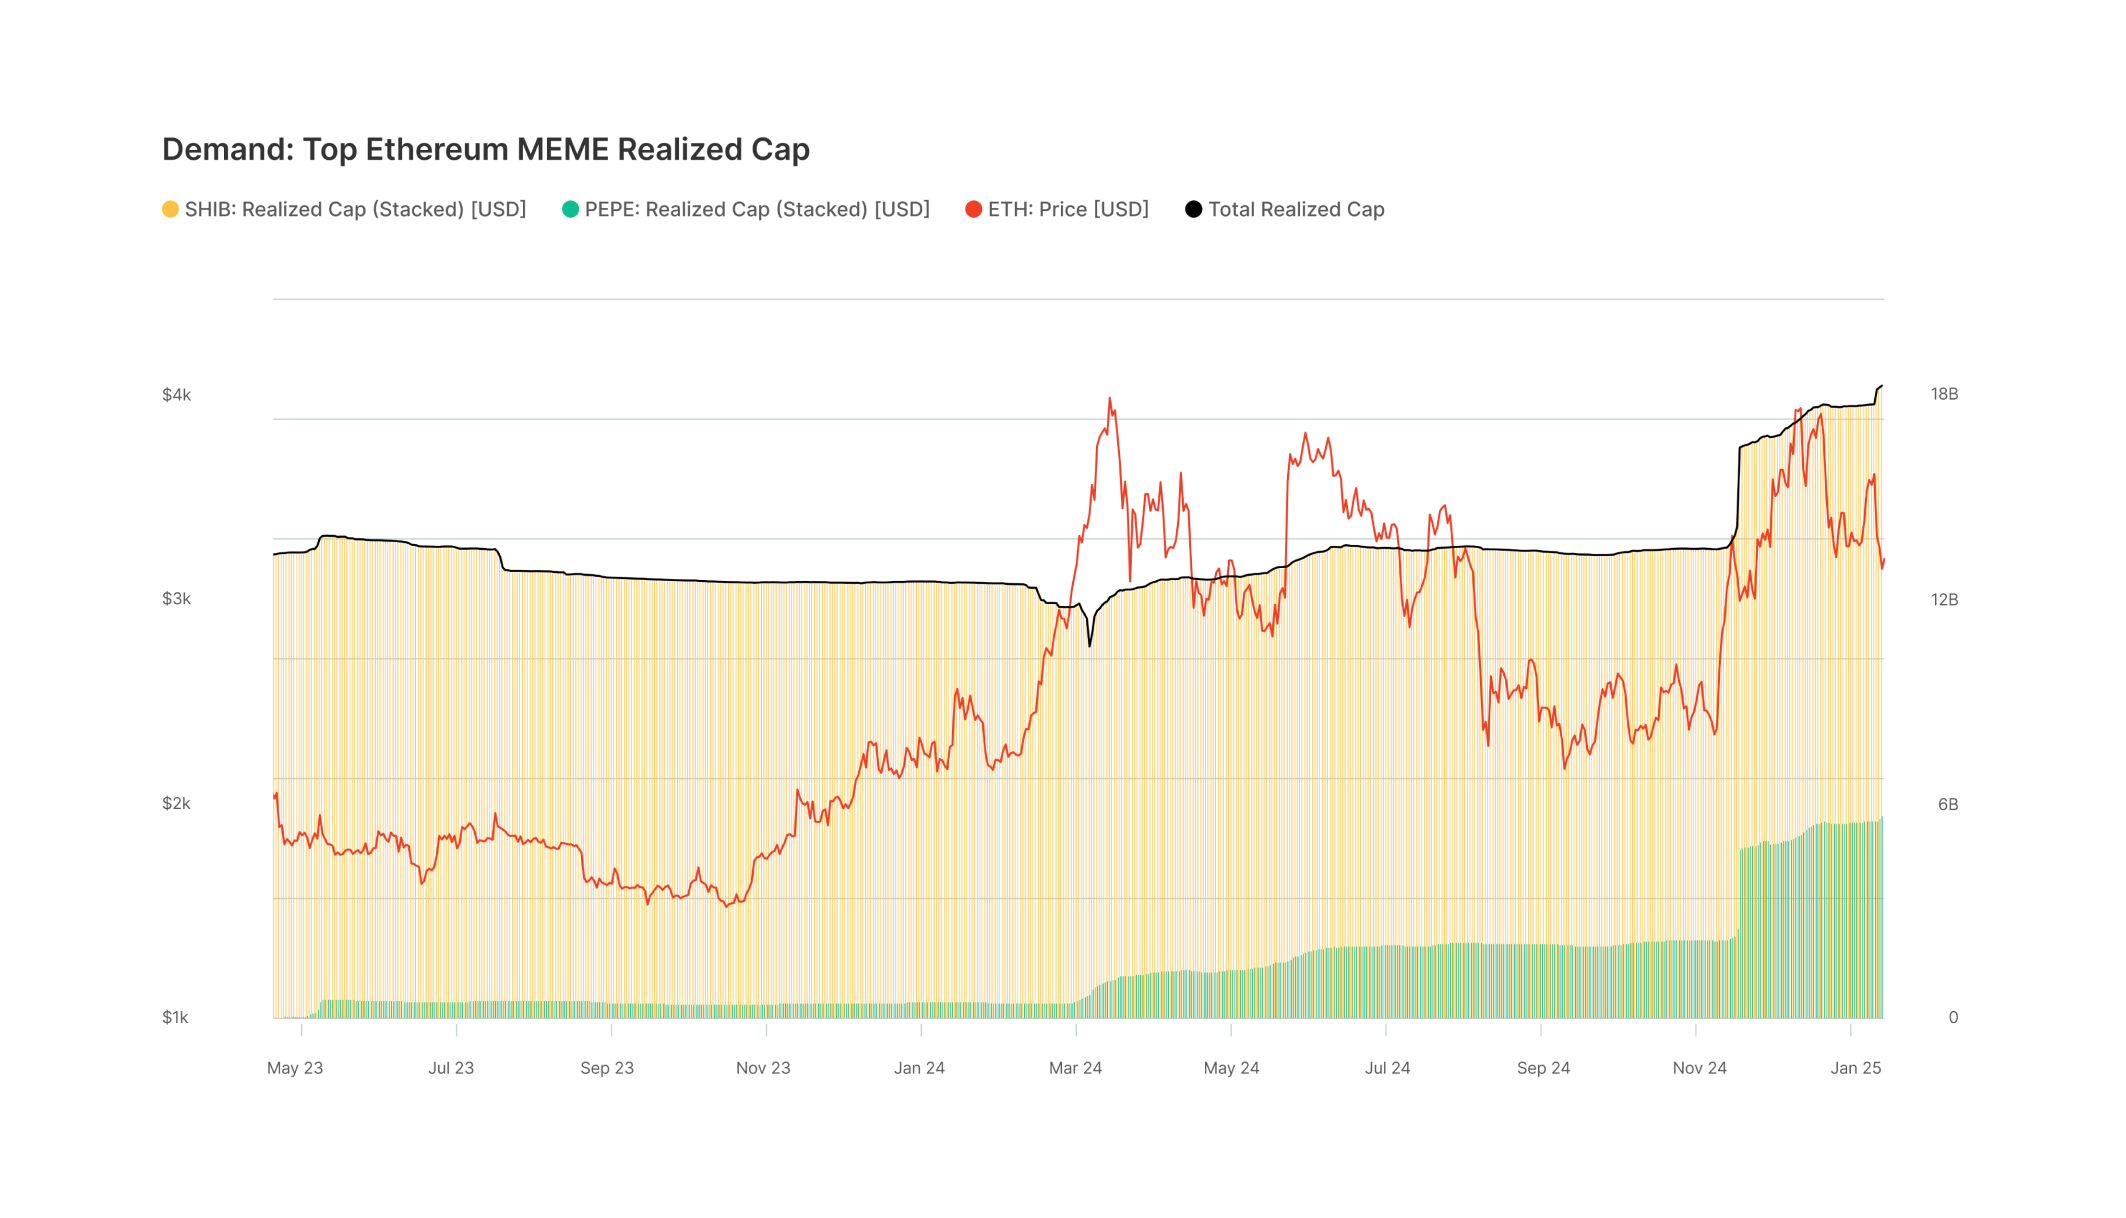
Memecoins have been a prominent feature of our current cycle, garnering significant attention and capital from retail investors. Notably, the Memecoin sector on Solana has witnessed a significantly higher relative capital inflow compared to Ethereum, underscoring the preference of retail investors to speculate on native Solana assets.
- Altcoins initially gained market relevance on the Ethereum network during the 2017 ICO boom and have since attracted significant capital. This growth was further accelerated in 2021 due to liquidity injections following the COVID-19 pandemic, which propelled altcoin valuations to remarkable heights.
- Throughout 2024, memecoins were a prominent feature of the cycle, attracting the largest share of capital across altcoins.
- When measuring the aggregate realized cap of the top two meme assets on Ethereum (SHIB & PEPE) since January 2024, we can observe that the realized cap has grown from $12.7B to $18.4B, equivalent to a +$5.7B (+45%) increase.
- Measuring the aggregate realized cap of the top meme assets on Solana (BONK & WIF) across the same time period, we can observe that the realized cap has grown from $901M to $4.3B, equivalent to a +$3.4B (+477%) increase.
- The relative capital inflow for Solana’s top two memecoins is significantly higher than that of Ethereum’s top two memecoins, indicating strong retail interest in Solana-based assets.
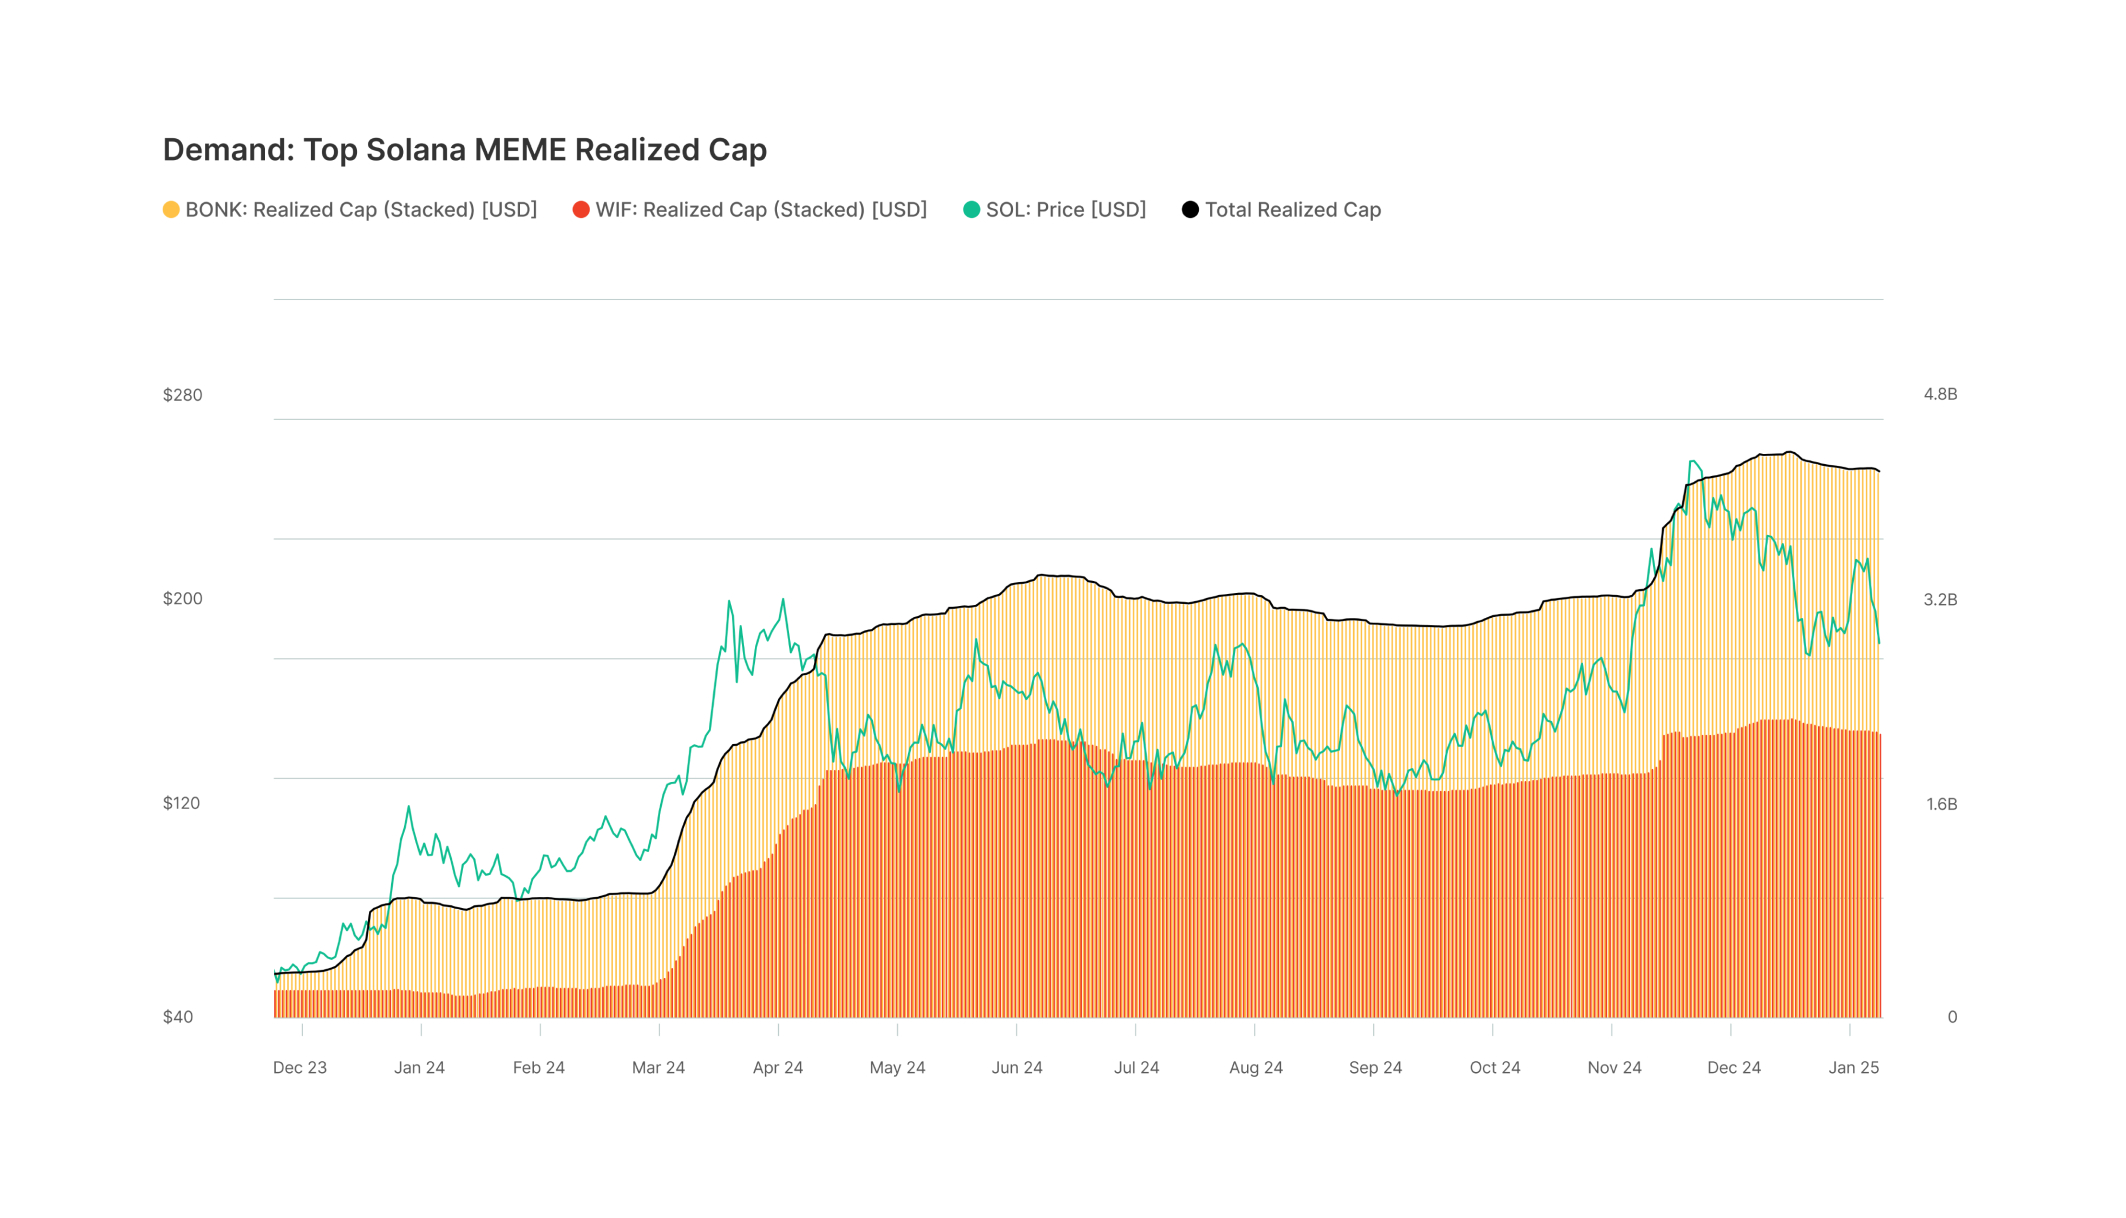
- Measuring the aggregate realized cap of the top meme assets on Solana (BONK & WIF) across the same time period, we can observe that the cumulative capital inflow into the top two memecoins on Solana was $4B (+1330%).
- Measuring the aggregate realized cap of the top meme assets on Solana (BONK & WIF) across the same time period, we can observe that the realized cap has grown from $901M to $4.3B, equivalent to a +$3.4B (+477%) increase.
- The relative capital inflow for Solana’s top two memecoins is significantly higher than that of Ethereum’s top two memecoins, indicating strong retail interest in Solana-based assets.


Regional Shifts
Onchain Activity Continues to Grow in APAC
Onchain Activity
Continues to Grow in APAC
When excluding exchanges and ETF flows, retail activity in the APAC region has grown at a faster clip than other geographies. By timestamping all transactions created by an entity with the working hours of different geographical regions, we can determine the probabilities for each entity being located in the US, Europe, or Asia.
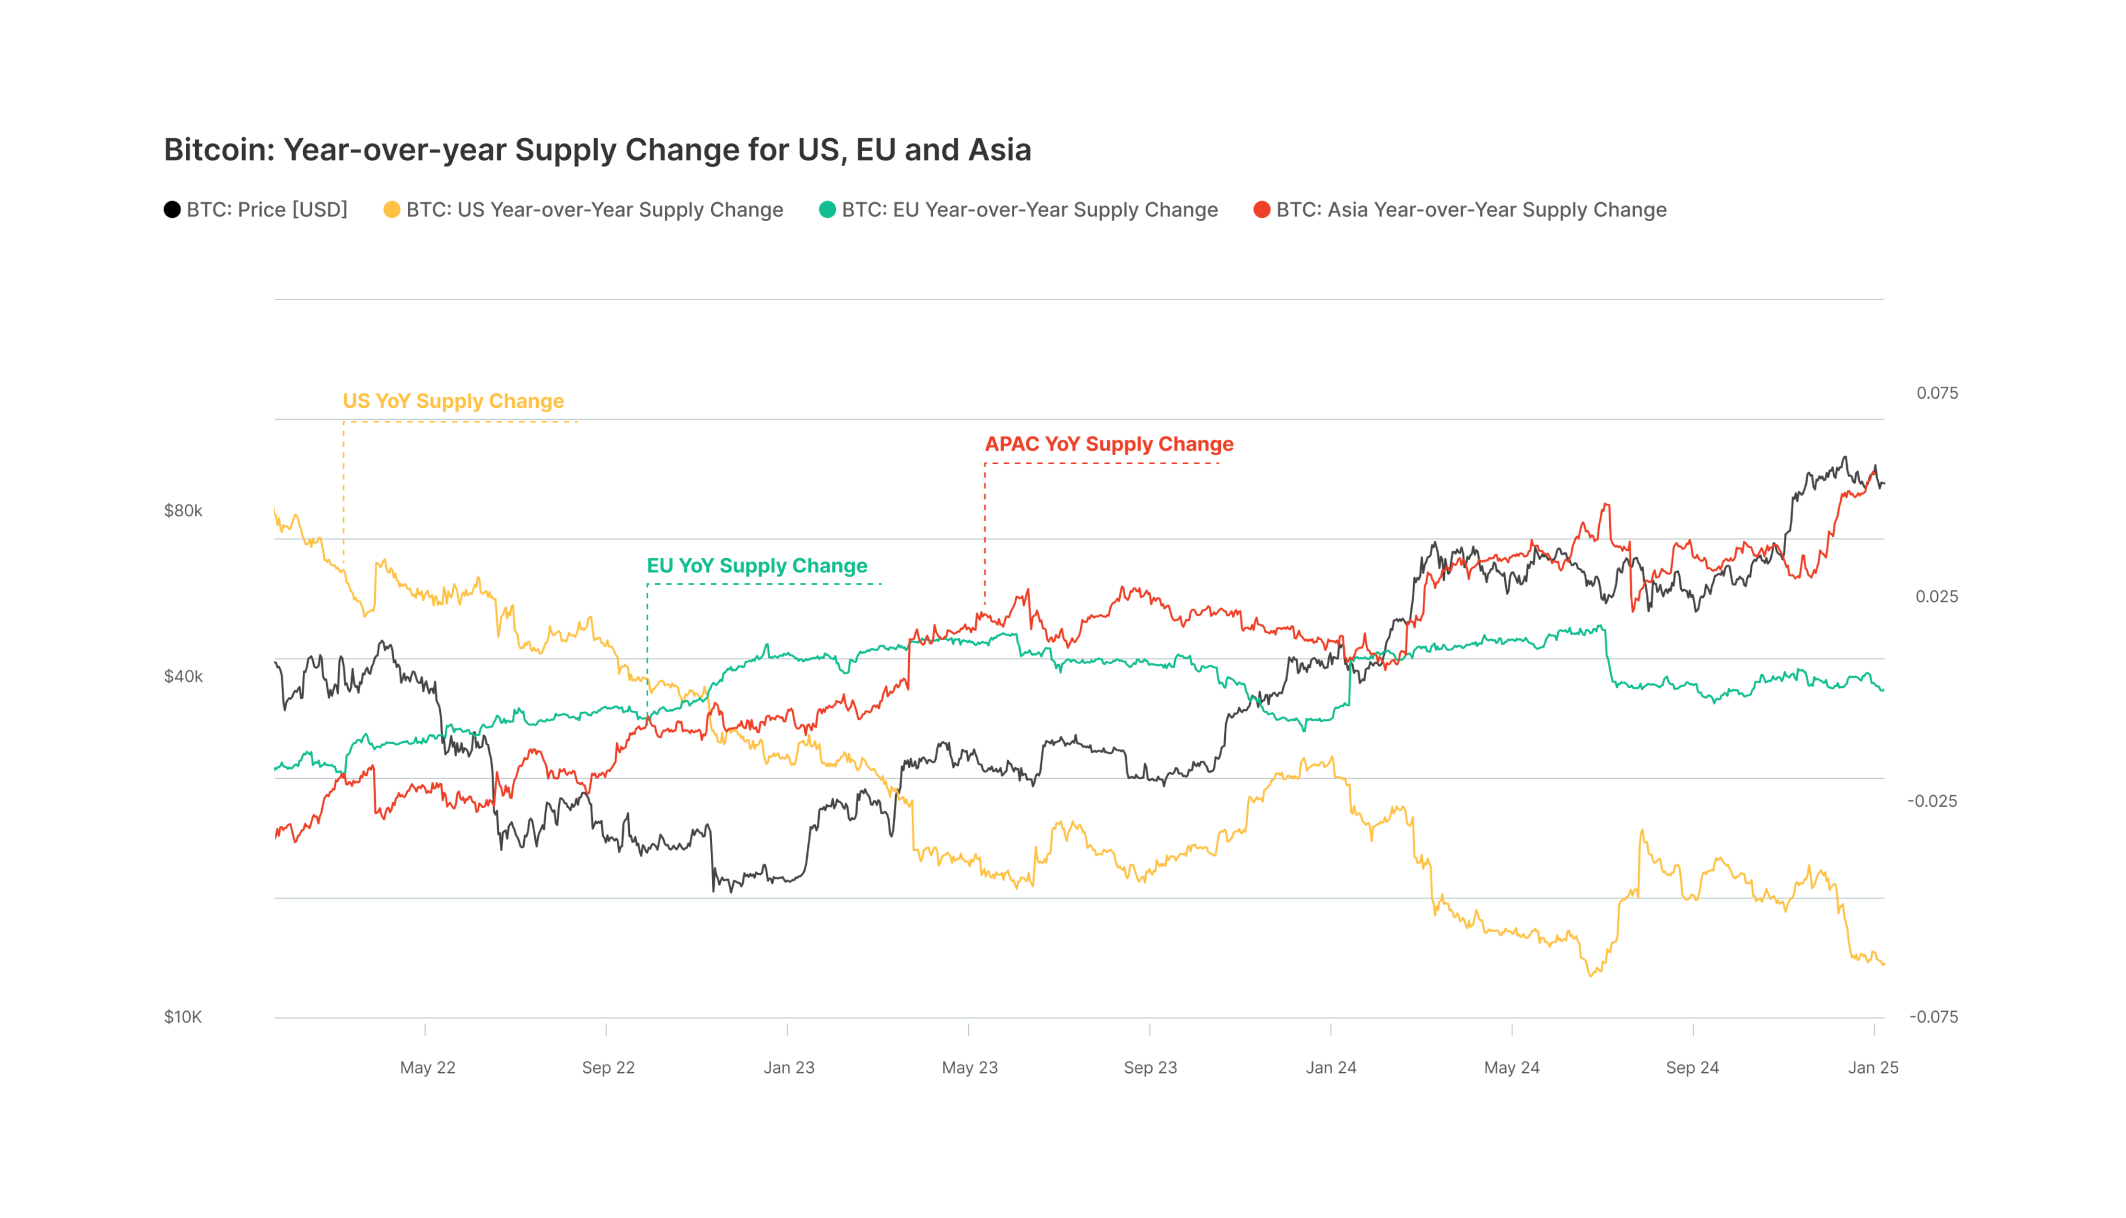
- Digital assets are global in nature, and regulations and policies often differ by jurisdiction. As a result, there are variations in the movement of capital in and out of digital assets based on different geographical regions.
- When evaluating since the cycle low in December 2022:
- APAC YoY Supply Growth: +6.4%
- EU YoY Supply Growth: -0.7%
- US YoY Supply Growth: -5.7%
- The highlight of the year for the digital asset ecosystem has been the movement of spot bitcoin ETFs to US capital markets. However, when we exclude the activity of exchanges and ETF flows (institutional presence), we are seeing large retail and individual growth outside of the US.
- This observation is interesting, reflecting an inverse in behavioral activity between the US and APAC areas, suggesting a shifting dominance in retail activity between the two regions.


ETFs
ETFs Represent a Growing Portion of Circulating Supply
The launch of spot ETFs for both Bitcoin and Ethereum in 2024 is a major highlight and catalyst for the prevailing bull cycle. They are some of the best performing ETFs in history, and have achieved total assets under management of $111.2B for BTC and $12.2B for ETH.

- On January 10, 2024, the first US spot bitcoin ETFs were approved, marking a monumental moment for the digital asset ecosystem. These ETF instruments provide institutional-grade investors with regulated spot exposure for the leading digital currencies (BTC and ETH), unlocking a new source of previously untapped demand.
- The institutional demand for regulated bitcoin exposure has been substantial, with the total assets under management across all ETF instruments now at a market value of $114.4B, equivalent to 5.9% of the circulating bitcoin supply
- The growth and demand of bitcoin and ethereum ETFs becomes apparent when compared to the gold ETFs. The first gold ETF started trading on March 28, 2003, and currently hold a combined $271B AUM. In the space of just 1 year, the bitcoin and ethereum ETFs have accrued 47% ($126.4B) of gold ETFs total AUM, underscoring the significant institutional demand for regulated digital asset instruments.
- In the space of just 1 year, the Bitcoin and Ethereum ETFs have accrued 46% ($123.4B) of Gold ETFs total AUM, underscoring the significant institutional demand for regulated digital asset instruments.
- On January 10, 2024, the first US spot bitcoin ETFs were approved, marking a monumental moment for the digital asset ecosystem. These ETF instruments provide institutional-grade investors with regulated spot exposure for the leading digital currencies (BTC and ETH), unlocking a new source of previously untapped demand.
- The institutional demand for regulated bitcoin exposure has been substantial, with the total assets under management across all ETF instruments now at a market value of $114.4B, equivalent to 5.9% of the circulating bitcoin supply
- The growth and demand of bitcoin and ethereum ETFs becomes apparent when compared to the gold ETFs. The first gold ETF started trading on March 28, 2003, and currently hold a combined $271B AUM. In the space of just 1 year, the bitcoin and ethereum ETFs have accrued 47% ($126.4B) of gold ETFs total AUM, underscoring the significant institutional demand for regulated digital asset instruments.
- As previously mentioned, the successful launch of the US spot bitcoin ETFs unlocked a source of latent demand for regulated exposure to the leading digital asset.
- Since the product's inception just over 1 year ago, US spot bitcoin ETFs have acquired a substantial +515K BTC.
- Bitcoin miners are an essential entity within the Bitcoin network, responsible for the building and ordering of blocks, and the defense against reorganization of the chain. As a reward, miners receive newly issued coins and transaction fees.
- When measuring from the inception of the US spot bitcoin ETFs, miners have issued +215K BTC into the circulating supply.
- When we compare the coins acquired by the ETFs to the coins issued by miners, we find that the ETFs have acquired 2.4x the number of coins issued, underscoring the elevated level of demand for the product.
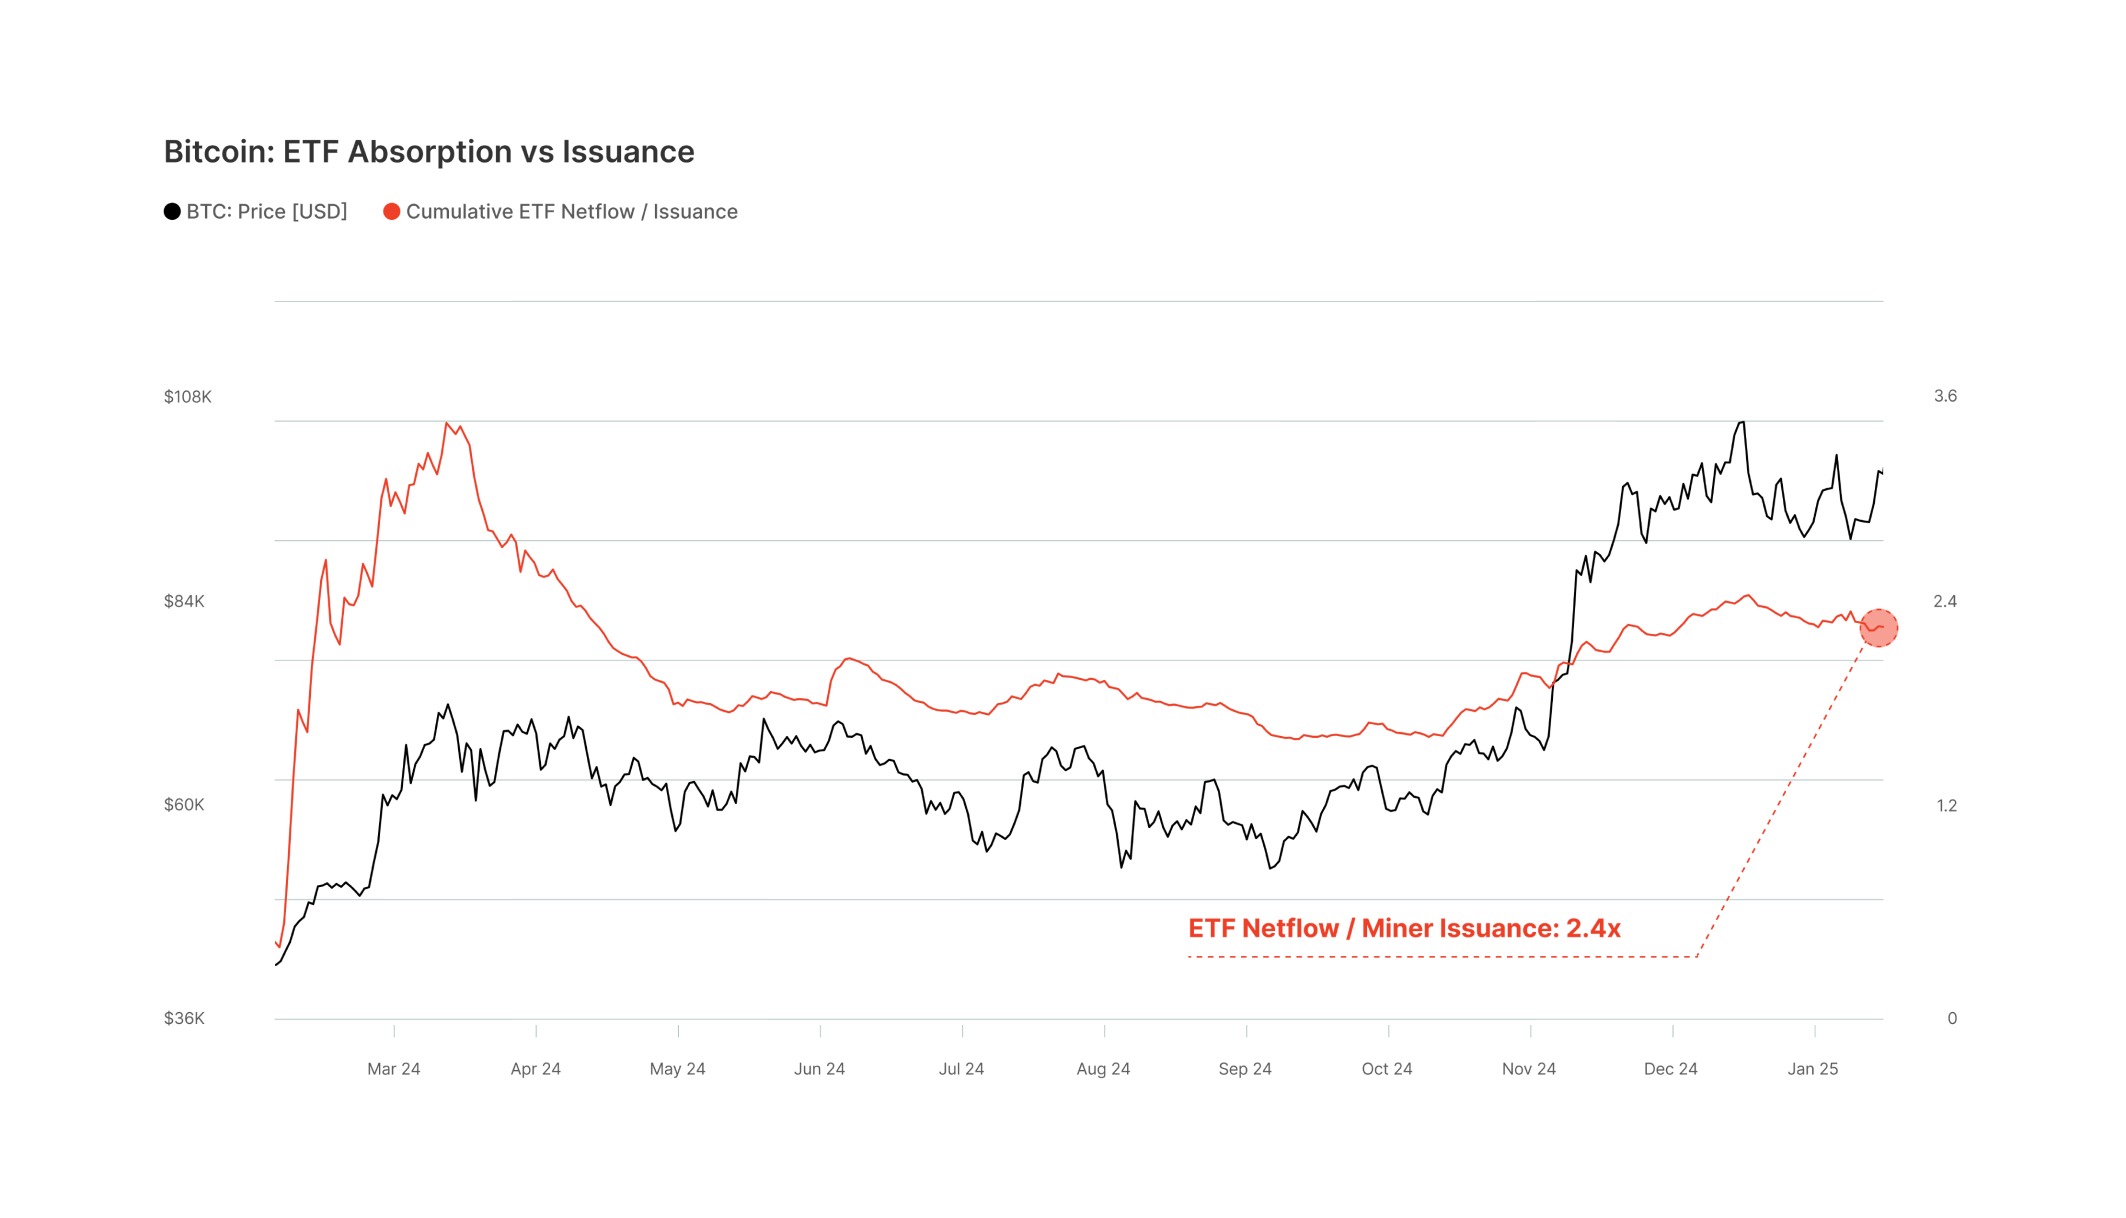
- As previously mentioned, the successful launch of the US spot bitcoin ETFs unlocked a source of latent demand for regulated exposure to the leading digital asset.
- Since the product's inception just over 1 year ago, US spot bitcoin ETFs have acquired a substantial +515K BTC.Since the product's inception just over 1 year ago, US spot bitcoin ETFs have acquired a substantial +515K BTC.
- Bitcoin miners are an essential entity within the Bitcoin network, responsible for the building and ordering of blocks, and the defense against reorganization of the chain. As a reward, miners receive newly issued coins and transaction fees.
- When measuring from the inception of the US spot bitcoin ETFs, miners have issued +215K BTC into the circulating supply.
- When we compare the coins acquired by the ETFs to the coins issued by miners, we find that the ETFs have acquired 2.4x the number of coins issued, underscoring the elevated level of demand for the product.


The Bottom Line
The Crypto Trends Report provides a comprehensive view of the current state of the digital asset market. From retail resurgence to Solana’s rapid rise and regional growth in APAC, the report underscores key trends shaping the industry today.
While the market continues to evolve, tools like spot ETFs and analytics platforms are enabling a new wave of participants—from institutional investors to retail traders—to engage with digital assets in innovative ways.


GO WHERE DOLLARS WON’T
Gemini, the trusted crypto-native finance platform.
